

Timelines can be extremely helpful in many types of trials. Whenever the order in which events occurred is a significant issue, or a jury or judge needs to understand how a story began and ended, a timeline is appropriate.
As Texas attorney and legal technology expert Jeffrey S. Lisson has written [pdf], “Timelines are the most effective way to give a judge or jury a sense of who did what, when, and to whom. Just as bar charts and graphs help the uninitiated make sense out of a sea of facts and figures, timelines show the relationship between events. Timelines generally show events laid out on a horizontal, constant chronological scale. Events – the writing of a memo, the reading of an x-ray, or the shooting of a gun – are listed in the order they occurred. While tables of dates and facts require effort to understand, timelines are instantly clear.”

Contrary to many people’s belief, PowerPoint presentations are well suited to the presentation of timelines and other litigation graphics. Because it is easy to add hyperlinks to a PowerPoint, an experienced designer can create an interactive presentation that allows the presenter to click on a “hot spot,” such as a document icon, name or date, and move directly to that item.
For example, in the exhibit, “Prior Art Interactive Patent Timeline Trial Graphics,” that we devised for a patent case, the presenter can show the history of the prior art related to a subsequent patented invention in any order that is convenient.
Similarly, in the “Hatch Waxman ANDA Timeline,” the colored bars represent periods of conversation with the Food and Drug Administration that delayed the approval of an Abbreviated New Drug Application (ANDA) for a generic drug. The timeline that we used shows visually that a citizen petition did not cause a delay in the approval of the generic drug. Rather, the delay resulted from the FDA taking its time in its review of the application. This timeline, which summarizes thousands of pages of documents, helped lead to a complete defense verdict for our client, a major pharmaceutical company.
The concept behind our exhibit, “EPA’s History of Vague Regulation and Unfair Enforcement” in a new source review case was to tell the history of EPA's lack of enforcement and inconsistent messages -- and the industry’s success in lowering pollution from coal-fired power plants in spite of the EPA’s inaction. It is possible to add other information to a timeline to make it tell more of a story and persuade, not just inform. Using timelines as a persuasion tool throughout a trial represents a higher level of advocacy than merely putting events in chronological order. Click the image to zoom.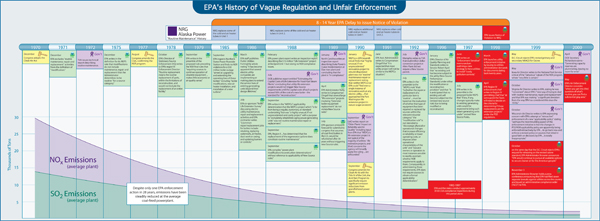
Like any litigation graphics shown to a fact-finder, the timeline can and should be a persuasion tool. We believe it should tell a story without having to read all or even most text entries. Should individual timeline entries seem to be inconsistent with the overall trial theme or should juxtaposing them with a long term graph underscore that correlation does not equate with causation, we advise telling that story visually as above.


Leave a Comment