


by Ken Lopez
Founder/CEO
A2L Consulting
I spotted an interesting blog post over the weekend that criticized a New York Times article about the Israeli-Arab conflict for using charts and data in a misleading way. I've written about cheating with charts before in several articles, but my 2012 article, 5 Demonstrative Evidence Tricks and Cheats to Watch Out For, in particular, offers some good lessons and has been read by thousands of people.
Although it is taken from a very different context than courtroom litigation, the blog post about the Middle East and the Times contains good lessons for both offense and defense when it comes to creating or refuting litigation graphics.
The authors levy five key complaints against the New York Times article and its use of graphics to support a narrative.
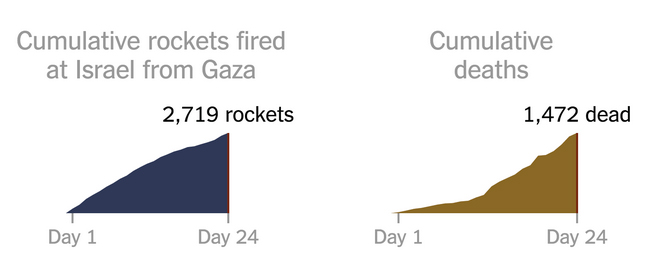
First, they discuss misleading with proximity, saying that the Times placed two charts next to each other to suggest causation when there was only a correlation -- or at least an incomplete story. This is pretty common in the world of charts, and there are entire web sites that poke fun at supposed causation in charts. This site by a Harvard Law student makes fun of fallacious causation by showing a purported connection between such topics as people who drown in swimming pools in a particular year and the number of Nicolas Cage films that year.

The second and third charges made by the blog authors involve omitting and obfuscating. Inconvenient data that does not support the thesis can be omitted, and when it is not omitted, it can be obfuscated, for example by lumping it together with other, unrelated data. The fourth charge is related to the first three – manufacturing a pattern by the repeated use of misleading graphics. The fifth charge involves an old-fashioned method of deception – using loaded language to accompany a chart, or language that involves assumptions that have not been proved.
As the blog authors wrote – and this applies equally well to trial persuasion as to journalism: “Design is just as much an editorial tool as it is a tool of aesthetics, usability and user experience. Use your power as a designer wisely. A common misconception about data journalism is that it’s somehow less biased than traditional print journalism. Use of data lends an air of objectivity and legitimacy to a piece of journalism, and that goes double when it’s beautifully visualized.”
I find particularly relevant the bloggers’ critique of the juxtaposition of two charts and how that technique can lead someone to a conclusion just because the charts were placed next to each other. I find this thought especially useful either in a courtroom setting or when litigation graphics are placed in a brief or expert report.
Here is an example of a chart that is duplicated below (click on the chart to see the original). As the authors point out, you might think the rockets caused the deaths due to the chart placement. However, the reality is that very few deaths were actually caused by rockets.
Our job as trial consultants is not to trick or deceive the jury but to persuade effectively and ethically using the available tools. Here I don't think that an ethical line is being crossed, and I do think this is a fair form of persuasion. However I might object to it nonetheless if I were on the other side.
Other articles and resources discussing litigation graphics, cheating with graphics, chart tricks and more from A2L Consulting:
- 5 Demonstrative Evidence Tricks and Cheats to Watch Out For
- Font Matters - A Trial Graphics Consultant's Trick to Overcome Bias
- Persuasive Graphics: How Pictures Are Increasingly Influencing You
- Free Download: Using Litigation Graphics to Persuade
- Why the President is Better than You at Creating Persuasive Graphics
- 15 Awesome Infographics for Lawyers
- What is a Litigation Consultant Infographic
- How to Portray Your Client as Hero Infographic
- Building Advocacy Presentation Visuals and Persuasive Graphics
- 14 Places Your Colleagues are Using Persuasive Graphics That Maybe You're Not
- How to Make PowerPoint Trial Timelines Feel More Like a Long Document
- 12 Ways to Eliminate "But I Need Everything On That PowerPoint Slide"
- Good-Looking Graphic Design ≠ Good-Working Visual Persuasion

Leave a Comment