Search

Loading

Free Subscription

Your email:

Voted Best Demonstrative Evidence Provider by the readers of LegalTimes 2011-2012

Authors

KenLopez resized 152

Ken Lopez founded A2L Consulting in 1995. The firm has since worked with litigators from all major law firms on more than 10,000 cases with over $2 trillion cumulatively at stake.  The A2L team is comprised of psychologists, jury consultants, trial consultants, litigation consultants, attorneys and information designers who provide jury consulting, litigation graphics and trial technology.  Ken Lopez can be reached at lopez@A2LC.com.


Ryan Flax A2L patent litigation graphics 

Ryan H. Flax, Esq., Managing Director, Litigation Consulting, joined A2L Consulting on the heels of practicing Intellectual Property (IP) law as part of the Intellectual Property team at Dickstein Shapiro LLP, a national law firm based in Washington, DC.  Over the course of his career, Ryan has obtained jury verdicts totaling well over $1 billion in damages on behalf of his clients and has helped clients navigate the turbulent waters of their competitors’ patents.  Ryan can be reached at flax@a2lc.com.


TheresaVillanueva Esq resized 166
As Director, Litigation Consulting, Theresa Villanueva, Esq. has consulted on more than 200 cases. Prior to her tenure as a litigation consultant, Ms. Villanueva worked as an attorney focusing on MDL, international products liability, toxic tort matters, and as in-house counsel handling title insurance claims, settlements and compliance with multi-state regulations.  Ms. Villanueva can be reached at villanueva@A2LC.com.

Posts by Category

Follow A2L Consulting

Member Red Well Blog

The Litigation Consulting Report

Current Articles | RSS Feed RSS Feed

Trial Presentation Graphics: Questioning Climate Change in Litigation


In trial presentation graphics, a great deal can depend on the quantity of data that is presented to the jury and on the way in which it is presented.

For example, it has become conventional wisdom that humans generate pollution in the form of carbon dioxide, that carbon dioxide and other pollutants cause a greenhouse effect on the planet, and that this effect noticeably raises global temperatures and/or causes climate change. Al Gore's movie, An Inconvenient Truth, cemented this belief in the minds of the public and future jurors, largely through the use of effective visual presentations.


The U.S. Government chart below captures the conventional wisdom well. As large quantities of carbon dioxide entered the atmosphere with rapid industrialization in the past 100 years or so, global temperatures went up, it shows.

Trial Presentation Graphics Climate Change


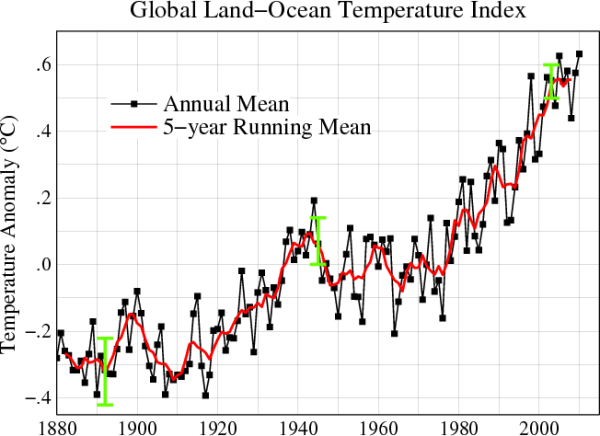
Because of the recent rapid spread of the conventional wisdom, as illustrated in charts like this one, it has become almost unthinkable to suggest an alternative. But in the trial context, it can be necessary to do just that.

Climate change litigation is making its way through court systems around the world. The targets can be government agencies or large power companies, especially the coal-fired power plant industry. Should a jury be called upon to decide such a case, conventional wisdom will be on the side of the plaintiffs. But the defendants are entitled to show their version of the world’s fluctuations in average temperature – without falsifying facts, of course.

The answer is to add more data that can call into question the conventional wisdom. Changing the scale of the horizontal and vertical axes can change the climate story.


We believe the above 2.5-minute PowerPoint presentation goes a long way toward making the defendant's case that global warming of human origin is not a scientific certainty. By expanding the time frame from 120 years or 1,000 years to 800,000 years or even more, this trial presentation graphic tells a different story from the conventional wisdom.

In the courtroom, our goal in using such trial exhibits would be to create enough doubt about the plaintiff's case so that a jury cannot reasonably award money to the plaintiff.  Using additional data from scientifically valid sources and from paleoclimatologists, telling this story in way that creates doubt is possible.

Our point in creating these trial presentation graphics is not to disprove climate change. Rather, our goal is to show how even the most skeptical viewer can be persuaded through the use of effective presentation graphics. Wasn't that part of what Al Gore taught us all?

We are in the business of telling the right story, our client's story. You can almost hear the closing argument that a defendant’s lawyer would make: "More data is better, isn’t it?  Does the other side want you to look at less data?  Do they want to hide the whole truth, inconvenient though it is?”

We welcome your feedback and encourage your comments below.


About A2L Consulting

A2L Consulting is a leading national litigation consulting firm founded in 1995.  We have worked with all major law firms on more than 10,000 cases with trillions of dollars cumulatively at stake.  A2L Consulting offers the following litigation support services:

A2L Consulting has personnel or a presence in Washington, DC, New York, NY, Boston, MA, Alexandria, VA, Atlanta, GA, Miami, FL, Chicago, IL, Houston, Texas, Los Angeles, CA, and San Francisco, California.  Our work frequently takes us to other locations such as Wilmington, DE, Philadelphia, PA, Phoenix, AZ, San Antonio, Palo Alto, Dallas, Detroit, Baltimore, Cleveland, Kansas City, Las Vegas, Pittsburgh, Richmond, Salt Lake City, Denver, London, Brussels and many other cities and countries around the world.  A2L Contact Information.
 

Claim a FREE Subscription to this Blog - The Litigation Consulting Report 


Comments

Great illustration, though it hits only one of many issues with the data, methods and conclusions offered by both sides of the anthropogenic climate change issue(s). Others include the accuracy of estimating temperature in the past based on questionable proxies, the accuracy of the current temperature record (e.g., how accurate are/were temperature measurements), and what are the error rates of the proxy methods used to estimate previous temperatures are just a few of the potential issues with these types of analysis/predictions.  
 
Scale is an issue that has significant impact on time and spatial data but is almost never addressed. For example, the entire environmental justice movement/industry is based on a study done at county scale where the data appears to support one conclusion. Since that study was done in 1982, many other researchers have looked more closely at this issue and found that when using data that looks at a much smaller scale, the opposite conclusion is supported by the data/analysis.  
 
Your illustration points out the utility of closely examining analysis and underlying data offered to support a conclusion. I've found this to be helpful for examining analysis/data offered by both sides of a case.
Posted @ Tuesday, June 28, 2011 8:57 AM by Rick Crowsey
Rick - Thanks for the thoughtful comment. I'd be interesting in seeing the follow up studies to the 1982 study you mention. If easy to get to, please post a link here or shoot me an email. Best - Ken
Posted @ Tuesday, June 28, 2011 10:12 AM by Ken Lopez
Hi Ken, 
 
I sent you an email with the papers, plus a couple more. Since I got these through my library account under an educational fair use license, I'm hesitant to post them for wide distribution. If you think it'd be of value to others who read your blog, I can post the citations so folks can run them down on their own.
Posted @ Wednesday, June 29, 2011 1:33 PM by Rick Crowsey
Hi Rick - Thanks for the great info! I really appreciate it, and yes, I think there is value in posting some citations. Please do. Best, Ken
Posted @ Wednesday, June 29, 2011 6:26 PM by Ken Lopez
Hi Ken, here are the citations for the papers I sent you. There are many others worth reading, but these do a pretty good job of telling the story of environmental justice from the perspective of where it came from and the state of the science. Toxic sites in the U.S. are a problem for all citizens. For several decades Environmental Justice was used as a banner for political leverage, though now that credible science is being done in this area, it's become less of a factor. The bottom line is that it's complicated and we haven't really yet figured out how to assess risk to people from exposure or proximity to toxic waste sites in the U.S. 
 
Peach, J. D. (1983). Siting of Hazardous Waste Landfills and Their Correlation with Racial and Economic Status of Surrounding Communities. G. A. Office. Washington, D.C., General Accounting Office. 
 
Chavis Jr., B. F. and C. Lee (1987). Toxic Wastes and Race in the United States: A National Report on the Racial and Socio-Economic Characteristics of Communities with Hazardous Waste Sites. New York, NY, Commission for Racial Justice: 86. 
 
Been, V. (1995). "Analyzing Evidence of Environmental Justice." Journal of Land Use & Environmental Law 11(1): 28. 
 
Bowen, W. (2002). "An Analytical Review of Environmental Justice Research: What Do We Really Know?" Environmental Management 29: 3-15. 
 
Davidson, P. and D. L. Anderton (2000). "Demographics of Dumping II: A National Environmental Equity Survey and the Distribution of Hazardous Materials Handlers." Demography 37(4): 461-466. 
 
Anderton, D. L., A. B. Anderson, et al. (1994). "Environmental Equity: The Demographics of Dumping." Demography 31(2): 229-248. 
 
Cutter, S. L., D. Holm, et al. (1996). "The Role of Geographic Scale in Monitoring Environmental Justice." Society for Risk Analysis 16(4): 517-526. 
Posted @ Thursday, June 30, 2011 7:08 AM by Rick Crowsey
I like the last graph in the video. According to it, we can expect increasing temperatures for awhile. Its also important to note that the Carbon is not man-made. We are releasing it from storage in the earth's crust. But at one time, that carbon was probably airborne.
Posted @ Saturday, July 02, 2011 7:43 AM by George
George-Thanks for the comment!
Posted @ Saturday, July 02, 2011 10:27 AM by Ken Lopez
Post Comment
Name
 *
Email
 *
Website (optional)
Comment
 *

Allowed tags: <a> link, <b> bold, <i> italics